
I've been selling credit spreads for over a decade. They're the workhorse of my long-term growth — defined risk, defined reward, no need to be right about direction, just right about where price won't go.
Until now, Premium Insights didn't track them properly. You could enter the legs, but each leg lived as its own row. The math you cared about — net credit, capital at risk, return on max risk, breakeven — you had to compute yourself, on top of a journal that was telling you one number ("the short leg returned X") while your broker showed you a different one ("the spread returned Y").
That ends today.
What's supported
- Bull put spreads — sell a put, buy a lower-strike put. Net credit, defined max loss = (short strike − long strike) × 100 × qty − net credit.
- Bear call spreads — sell a call, buy a higher-strike call. Same idea, inverted.
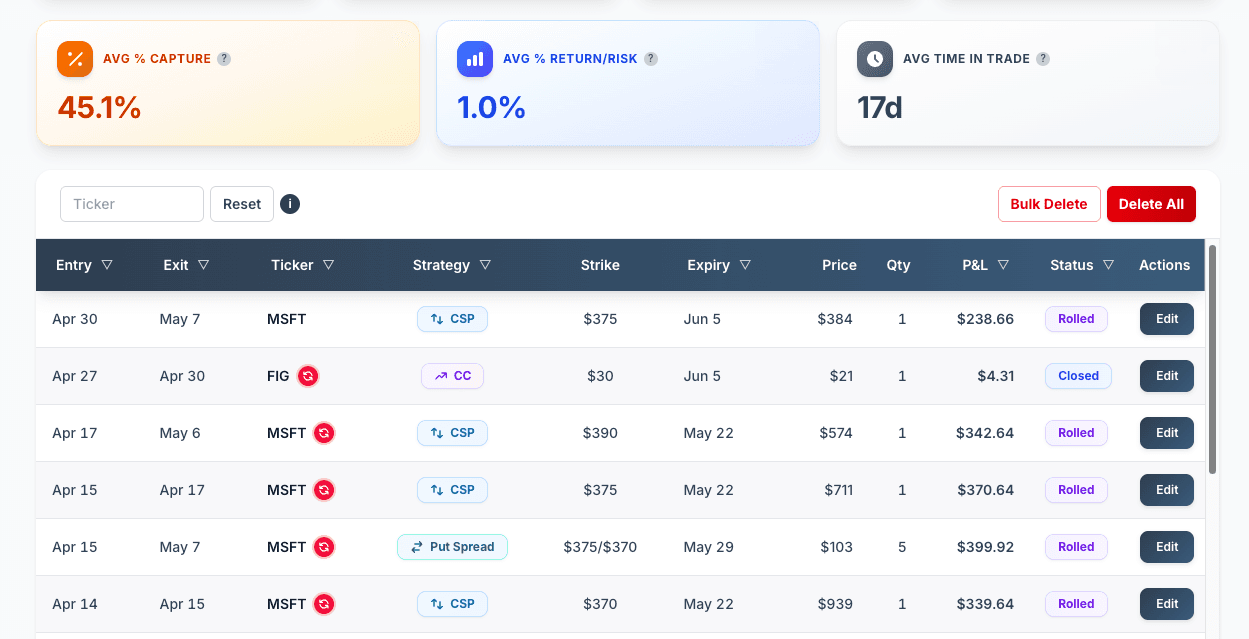
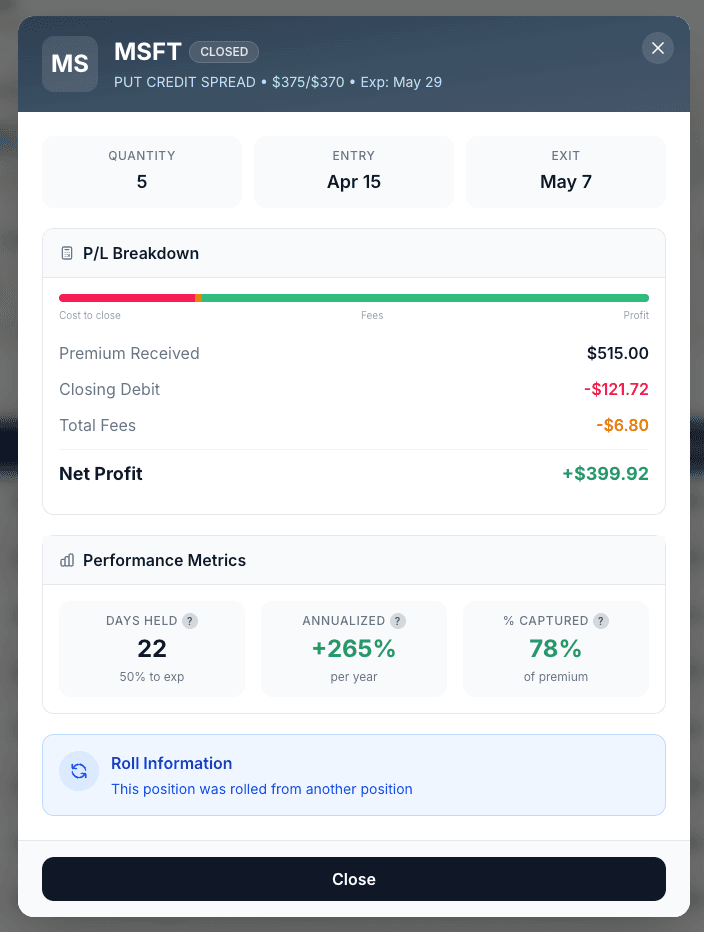
Both render as a single row in the trades table. P&L, collateral, max loss, max profit, return on max risk, breakeven, days held — all computed once, consistently, at the position level. Same canonical math that powers your CSP and covered call numbers.
How detection works
CSV imports. When you upload a Fidelity, Robinhood, Schwab, IBKR, Questrade, or generic CSV that contains spread pairs — two option fills with the same ticker, same expiration, different strikes, opposing directions — Premium Insights detects them automatically. Before commit, you'll see a preview with the proposed pairings and can split them back into single-leg trades with one click if the auto-pair is wrong.
Manual entry. New Trade modal has "Put Credit Spread" and "Call Credit Spread" options. Pick one and a second strike field appears for the bought leg.
The math
Spreads now behave like a single position, not two trades. Four numbers do the heavy lifting:
The capital actually at risk if both legs go against you.
Sum across both legs. The premium you keep if the spread expires worthless.
True ROI on the capital at risk — not on full collateral. Comparable across spread widths.
The price where the spread starts losing money at expiration.
Days held, realized P&L on close, and win rate all aggregate at the position level — same as every other strategy. If you've been carrying spreads as two unrelated trades in another journal, your numbers were almost certainly wrong somewhere. This is the fix.
What's not here yet
Iron condors still show as two separate credit spreads (a bull put + a bear call). The individual spreads render correctly, but the Risk page double-counts the collateral — the real max loss on an iron condor is bounded by whichever wing is breached, not both at once. Iron condor support as a single 4-leg position is on the roadmap.
Spread-native analytics — width efficiency, R/R ratios, defined-risk-as-%-of-account — are deferred to a future release.
Live broker sync for spreads via SnapTrade is in development and ships with the broader broker-lifecycle work later this quarter.
Try it
Open your trades, import a CSV with credit spreads in it, or add one manually through the New Trade modal. Pick a closed spread and compare the realized P&L, max loss, and return on max risk to what your broker shows. If something looks off, reply — spreads were one of the last big strategies the tool didn't handle properly, and I want to know if any cases are still slipping through.
— Credit Spread Investing